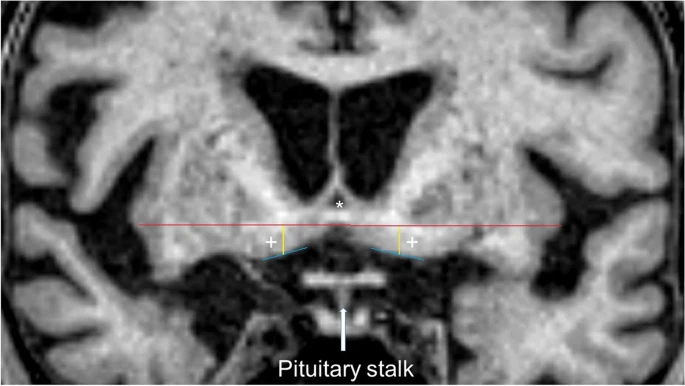
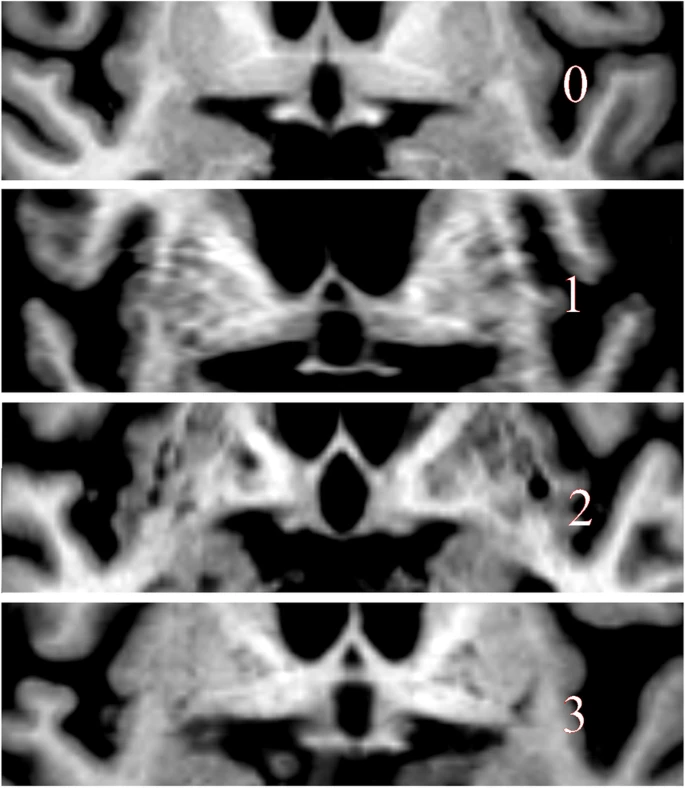
Using visual score to measure atrophy of substantia innominata


Reference: Khadhraoui, E., Müller, S.J., Hansen, N. et al. Manual and automated analysis of atrophy patterns in dementia with Lewy bodies on MRI. BMC Neurol 22, 114 (2022). https://doi.org/10.1186/s12883-022-02642-0

Using visual scales to determine brain atrophy subtypes in Alzheimer’s Disease

AD subtypes based on patterns of brain atrophy. Regional atrophy was measured with the MTA, PA, and GCA-F visual rating scales based only on T1-weighted images. In the 3 visual rating scales, a score of zero denotes no atrophy, whereas scores from 1 to 3 (PA and GCA-F) or 4 (MTA) indicate an increasing degree of atrophy. The typical AD subtype was defined as abnormal MTA together with abnormal PA and/or abnormal GCA-F. The limbic-predominant subtype was defined as abnormal MTA alone with normal PA and GCA-F. The hippocampal-sparing subtype included abnormal PA and/or abnormal GCA-F but normal MTA. The minimal atrophy subtype was defined as normal scores in MTA, PA, and GCA-F. The figure shows examples of each subtype in axial and coronal sections of the brain. AD, Alzheimer’s disease; MTA, medial temporal atrophy scale; PA, posterior atrophy scale; GCA-F, global cortical atrophy scale – frontal subscale; A, anterior part of the brain; P, posterior part of the brain; R, right; L, left.

Medial temporal atrophy in preclinical dementia: visual and automated assessment during six year follow-up

Medial temporal lobe (MTL) atrophy is an important morphological marker of many dementias and is closely related to cognitive decline. In this study we aimed to characterize longitudinal progression of MTL atrophy in 93 individuals with subjective cognitive decline and mild cognitive impairment followed up over six years, and to assess if clinical rating scales are able to detect these changes. All MRI images were visually rated according to Scheltens' scale of medial temporal atrophy (MTA) by two neuroradiologists and AVRA, a software for automated MTA ratings. The images were also segmented using FreeSurfer's longitudinal pipeline in order to compare the MTA ratings to volumes of the hippocampi and inferior lateral ventricles. We found that MTL atrophy rates increased with CSF biomarker abnormality, used to define preclinical stages of Alzheimer's Disease. Both AVRA's and the radiologists' MTA ratings showed a similar longitudinal trajectory as the subcortical volumes, suggesting that visual rating scales provide a valid alternative to automatic segmentations. While the MTA scores from each radiologist showed strong correlations to subcortical volumes, the inter-rater agreement was low. We conclude that the main limitation of quantifying MTL atrophy with visual ratings in clinics is the subjectiveness of the assessment.

Imaging Patterns of Toxic and Metabolic Brain Disorders

Illustration shows the most important general imaging patterns in toxic and metabolic brain disorders. White areas = areas of involvement. These include symmetric basal ganglia and/or thalami involvement (axial view) (A); symmetric dentate nuclei involvement (axial view) (B); prominent cortical gray matter involvement (axial view) (C); symmetric periventricular white matter involvement (with gray matter sparing) (axial view) (D); corticospinal tract involvement (axial view) (E); corpus callosum involvement (coronal view) (F); asymmetric white matter involvement (demyelinating disease pattern) (axial view) (G); parieto-occipital subcortical vasogenic edema (axial view) (H); and central pons involvement (axial view) (I).
Reference: https://doi.org/10.1148/rg.2019190016

Linear vs volume measures of ventricle size in hydrocephalus: relation to present and future gait and cognition

Objective To compare the clinical utility of volume-based ratios with the standard linear ratio of Evans index (EI) by examining their associations with gait, cognition, and other patient and imaging variables. 
 Methods From MRI scans of 1,774 participants in the Mayo Clinic Study of Aging, we calculated 3 ventricle size measures: Evan index (frontal horn width divided by widest width of skull inner table), total ventricular volume, and frontal horn volume as ratios of total intracranial volume. Gait was measured by a timed 25-foot walk and cognition by a composite of psychometric tests. We also evaluated variables associated with the measures of ventricular size. Further, we evaluated gait and cognition associations with MRI of extraventricular findings seen in normal-pressure hydrocephalus: disproportionate enlargement of subarachnoid space (DESH) and focal sulcal dilations (FSD). 
 Results Ventricular volume measures had stronger association with gait and cognition measures than EI. In decreasing order of strength of association with ventricle size were DESH, FSD, white matter hyperintensity volume ratio, age, male sex, cortical thickness, and education. Modest evidence was observed that FSD was associated with future decline in gait and cognition. 
 Conclusion Ventricular volume measures are clinically more useful than EI in indicating current and future gait and cognition. Multiple factors are associated with ventricle volume size, including FSD and DESH, suggesting that changes in CSF dynamics may go beyond simple ventriculomegaly. 

 DOI: https://doi.org/10.1212/WNL.0000000000008673

Thalamic nuclei in frontotemporal dementia: Mediodorsal nucleus involvement is universal but pulvinar atrophy is unique to C9orf72

Thalamic atrophy is a common feature across all forms of FTD but little is known about specific nuclei involvement. We aimed to investigate in vivo atrophy of the thalamic nuclei across the FTD spectrum. A cohort of 402 FTD patients (age: mean(SD) 64.3(8.2) years; disease duration: 4.8(2.8) years) was compared with 104 age‐matched controls (age: 62.5(10.4) years), using an automated segmentation of T1‐weighted MRIs to extract volumes of 14 thalamic nuclei. Stratification was performed by clinical diagnosis (180 behavioural variant FTD (bvFTD), 85 semantic variant primary progressive aphasia (svPPA), 114 nonfluent variant PPA (nfvPPA), 15 PPA not otherwise specified (PPA‐NOS), and 8 with associated motor neurone disease (FTD‐MND), genetic diagnosis (27 MAPT, 28 C9orf72, 18 GRN), and pathological confirmation (37 tauopathy, 38 TDP‐43opathy, 4 FUSopathy). The mediodorsal nucleus (MD) was the only nucleus affected in all FTD subgroups (16–33% smaller than controls). The laterodorsal nucleus was also particularly affected in genetic cases (28–38%), TDP‐43 type A (47%), tau‐CBD (44%), and FTD‐MND (53%). The pulvinar was affected only in the C9orf72 group (16%). Both the lateral and medial geniculate nuclei were also affected in the genetic cases (10–20%), particularly the LGN in C9orf72 expansion carriers. Use of individual thalamic nuclei volumes provided higher accuracy in discriminating between FTD groups than the whole thalamic volume. The MD is the only structure affected across all FTD groups. Differential involvement of the thalamic nuclei among FTD forms is seen, with a unique pattern of atrophy in the pulvinar in C9orf72 expansion carriers.


Brain volumes and their ratios in Alzheimer´s disease on magnetic resonance imaging segmented using Freesurfer 6.0


  • Study shows 44 brain regions volume changes with Alzheimer's disease. 
  • Volumes were calculated both in absolute values and ratios to the whole brain volume. 
  • The hippocampo-horn proportion is effective for hippocampal atrophy evaluation. 
  • This method can be simplified for visual assessment.

A new MR imaging index for differentiation of progressive supranuclear palsy-parkinsonism from Parkinson's disease

Highlights

  • Distinguishing PSP-P from PD is challenging in the early stages of the disease.
  • Few data exist on the usefulness of MRPI for diagnosing PSP-P patients.
  • MRPI 2.0 is a new version of MRPI which includes the 3rd ventricular width.
  • MRPI 2.0 accurately differentiated patients with PSP-P from those with PD.
  • MRPI 2.0 accurately diagnosed PSP-P in the absence of vertical ocular palsy.

Abstract

Introduction

Differentiating clinically progressive supranuclear palsy-parkinsonism (PSP-P) from Parkinson's disease (PD) may be challenging, especially in the absence of vertical supranuclear gaze palsy (VSGP). The Magnetic Resonance Parkinsonism Index (MRPI) has been reported to accurately distinguish between PSP and PD, yet few data exist on the usefulness of this biomarker for the differentiation of PSP-P from PD.

Methods

Thirty-four patients with PSP-P, 46 with PSP-Richardson's syndrome (PSP-RS), 53 with PD, and 53 controls were enrolled. New consensus criteria for the clinical diagnosis of PSP were used as the reference standard. The MRPI, and a new index termed MRPI 2.0 including the measurement of the third ventricle width (MRPI multiplied by third ventricle width/frontal horns width ratio), were calculated on T1-weighted MR images.

Results

The MRPI differentiated patients with PSP-P from those with PD with sensitivity and specificity of 73.5% and 98.1%, respectively, while the MRPI 2.0 showed higher sensitivity (100%) and similar specificity (94.3%) in differentiating between these two groups. Both biomarkers showed excellent performance in differentiating PSP-P patients with VSGP from those with PD, but the MRPI 2.0 was much more accurate (95.8%) than MRPI in differentiating PSP-P patients with slowness of vertical saccades from PD patients.

Conclusion

The MRPI 2.0 accurately differentiated PSP-P patients from those with PD. This new index was more powerful than MRPI in differentiating PSP patients in the early stage of the disease with slowness of vertical saccades from patients with PD, thus helping clinicians to consolidate the diagnosis based on clinical features, in vivo.
DOI: https://doi.org/10.1016/j.parkreldis.2018.07.016

Parietal atrophy score on magnetic resonance imaging of the brain in normally aging people

Aim: Our intention was to create a simple visual evaluation of parietal atrophy on MRI of the brain useful in identifying neurodegenerative dementias, especially Alzheimer‘s disease. We assessed the changes of the parietal regions dur ing natural aging. Patients and methods: We created a new rat ing scale that we named the Parietal atrophy score. This method is based on semiquantitative scoring of three structures on coronal slices in the entire parietal lobe: parietal gyri, sulcus cingularis posterior and precuneus. Each structure was rated accord ing to the visual classification size as 0 – a normal size without atrophy, 1 – a borderline finding or 2 – a considerable atrophy. These ratings were sum marized into one score for each hemisphere and then these two were integrated into one score for the entire brain. Using a visual rating scale, we clas sified the parietal regions in 74 elderly subjects with a normal Mini-Mental State Examination score (29 ± 1 point) with a wide range of ages between 48–87 years. Results: Increas ing age is as sociated with a mild progression of the parietal lobe atrophy (r = 0.2; p = 0.05). The over all score of the parietal tissue was not as sociated with education, gender or hand dominance. Conclusion: Our new visual rating system of parietal atrophy is an easy and fast method for use in clinical practice. Natural aging is accompanied with negligible parietal atrophic changes. Parietal atrophy score on magnetic resonance imaging of the brain in normally aging people.

  • DOI: 
  • 10.14735/amcsnn2018414

A new MR imaging index for differentiation of progressive supranuclear palsy-parkinsonism from Parkinson's disease

Highlights

  • Distinguishing PSP-P from PD is challenging in the early stages of the disease.
  • Few data exist on the usefulness of MRPI for diagnosing PSP-P patients.
  • MRPI 2.0 is a new version of MRPI which includes the 3rd ventricular width
  • MRPI 2.0 accurately differentiated patients with PSP-P from those with PD.
  • MRPI 2.0 accurately diagnosed PSP-P in the absence of vertical ocular palsy.

Reference: Quattrone A, Morelli M, Nigro S, Quattrone A, Vescio B, Arabia G, Nicoletti G,Nisticò R, Salsone M, Novellino F, Barbagallo G, Le Piane E, Pugliese P, Bosco D, Vaccaro MG, Chiriaco C, Sabatini U, Vescio V, Stanà C, Rocca F, Gullà D, Caracciolo M. A new MR imaging index for differentiation of progressive supranuclear palsy-parkinsonism from Parkinson's disease. Parkinsonism Relat Disord. 2018 Sep;54:3-8. doi: 10.1016/j.parkreldis.2018.07.016

Corpus Callosum Index: A practical method for long-term follow-up in multiple sclerosis

Corpus callosum index


References
Pérez-Álvarez AI, Suárez-Santos P, González-Delgado M, Oliva-Nacarino P. Quantification of brain atrophy in multiple sclerosis using two-dimensional measurements. Neurologia. 2018 Jun 8. pii: S0213-4853(18)30152-X. doi: 10.1016/j.nrl.2018.04.004
Figueira, Fernando Faria Andrade, Santos, Valeria Silva dos, Figueira, Gustavo Medeiros Andrade, & Silva, Ângela Correa Marques da. (2007). Corpus Callosum Index: A practical method for long-term follow-up in multiple sclerosis. Arquivos de Neuro-Psiquiatria, 65(4a), 931-935. https://dx.doi.org/10.1590/S0004-282X2007000600001

A ‘Comprehensive Visual Rating Scale’ for predicting progression to dementia in patients with mild cognitive impairment

Background Numerous efforts have been made to identify biomarkers for predicting the progression of dementia in patients with mild cognitive impairment (MCI), and recently, a comprehensive visual rating scale (CVRS) based on magnetic resonance imaging (MRI) has been validated to assess structural changes in the brain of elderly patients. Based on this, the present study investigated the use of CVRS for predicting dementia and elucidated its association with cognitive change in patients with MCI over a three-year follow-up. Methods We included 340 patients with MCI with more than one follow-up visit. Data were obtained from the Alzheimer’s disease Neuroimaging Initiative study. We assessed all the patients using CVRS and determined their progression to dementia during a follow-up period of over 3 years. The cox proportional hazards model was used to analyze hazard ratios (HRs) of CVRS for disease progression. Further, multiple cognitive measures of the patients over time were fitted using the random effect model to assess the effect of initial CVRS score on subsequent cognitive changes. Results Of 340 patients, 69 (20.2%) progressed to dementia and the median baseline score (interquartile range) of CVRS significantly differed between stable MCI and progressive MCI (9 (5–13) vs 13 (8–17), p<0.001). The initial CVRS score was independently associated with an increased risk of progression to dementia (HR 1.123, 95% confidence interval [CI] 1.059–1.192). From 12 to 24 months, the effect of the interaction between CVRS and interval of follow-up visit on cognitive performance achieved significance (p<0.001). Conclusions Baseline CVRS predicted the progression to dementia in patients with MCI, and was independently associated with longitudinal cognitive decline.
Reference: Jang J-W, Park JH, Kim S, Park YH, Pyun J-M, Lim J-S, et al. (2018) A ‘Comprehensive Visual Rating Scale’ for predicting progression to dementia in patients with mild cognitive impairment. PLoS ONE 13(8): e0201852. https://doi.org/10.1371/journal.pone.0201852

New MRI visual rating scales

Six visual rating scales, three alreary described: medial temporal, posterior, anterior temporal and three new/addapted: orbito-frontal, anterior cingulate and fronto-insula) were assessed in this study

Time to perform visual rating
Mean time to perform and record all six visual rating scales based on three raters assessing the subset study population ( n = 80) was 2.9 ± 1.3 min. Individual rater means and standard deviations were 2.7 ± 1.1, 2.4 ± 1.0 and 3.6 ± 1.6 min.

Inter-rater reliability of visual rating scores
Single measure and average measure ICC results for each scale are shown in Supplementary Table 1 . For the single measures ICC values, representing the reliability of each scale at the level of the individual rater, the MTA scale performed best overall, with very similar results achieved with two raters assessing all 257 scans, and four raters scoring 80 scans [ICC(2,1) ≥ 0.79]. The PA, OF and FI scales also demonstrated good reliability [ICC(2,1) ≥0.71] based on two raters assessing the total study population; reliability was slightly reduced when performed by four raters in the subset population [ICC(2,1) ≥ 0.58]. The reliability of the AC scale was lowest overall [ICC(2,1) range = 0.49–0.62]. As expected, the reliability based on mean rater scores was consistently greater for all scales [ICC(2,k) ≥ 0.73]. There were no material differences in reliability based on the larger or smaller population samples for any scale with the exception of the AT and AC scales, which were less reliable in the larger population sample.

Correlation of grey matter volume with visual rating scores
Voxel-based morphometry analysis revealed a negative partial correlation of higher visual rating score with lower grey matter density for all visual rating scales. 

Reference:
Lorna Harper, Giorgio G. Fumagalli, Frederik Barkhof, Philip Scheltens, John T. O’Brien, Femke Bouwman, Emma J. Burton, Jonathan D. Rohrer, Nick C. Fox, Gerard R. Ridgway, Jonathan M. Schott; MRI visual rating scales in the diagnosis of dementia: evaluation in 184 post-mortem confirmed cases. Brain 2016; 139 (4): 1211-1225. doi: 10.1093/brain/aww005https://academic.oup.com/brain/article-lookup/doi/10.1093/brain/aww005

Methods used for measuring atrophy in Multiple Sclerosis


Location/generic methodologyMethodAdvantagesDisadvantages
Brain/linear and regional measuresThird ventricle widthEasy to implement; rapid analysis; standard acquisition methods; enables targeting of eloquent regionsLimited anatomical scope; may miss subtle effects; may exhibit user bias; high user input
Third ventricle volume
Brain width
Corpus callosum width
Volume on central brain slices
Stereology
Brain/whole brain segmentation approachesCSF volumesIncreased automation reduces user bias and user input; generally higher measurement precisionComplex analysis methods; possibly more complex acquisition schemes
BPF
WBR
BICCR
Fuzzy connectedness
Probabilistic segmentation (SPM)
TDS
SIENAX
Brain/registration‐based methodsMIDASRegional atrophy may become apparentComplex analysis methods; limited application to multiple sclerosis to date
Voxel‐based morphometry
SIENA
Spinal cordManual outliningStraightforwardPossible user bias; high user input
Semi‐automated outline of 3D axial imagesPrecise
Automated whole cord volume measurementLittle user inputComplex analysis methods; limited application to date
Optic nerveManual outliningStraightforwardPossible user bias; high user input
Semi‐automated outline of 3D axial imagesPrecise
Automated whole nerve volume measurementLittle user inputComplex analysis methods; limited application to date
TDS = template‐driven segmentation; MIDAS = Medical Image Display and Analysis Software.

Source: David H. Miller, Frederik Barkhof, Joseph A. Frank, Geoffrey J. M. Parker, Alan J. Thompson. Measurement of atrophy in multiple sclerosis: pathological basis, methodological aspects and clinical relevance . Brain 2002. DOI: http://dx.doi.org/10.1093/brain/awf177

Related publications: BALI: An MRI-Based Semiquantitative Index for the Evaluation of Brain Atrophy and Lesions

Categorizing and grading criteria of the BALI

Categories Criteria
GM-SV (gray matter lesions and small vessels) 0 = absence; 1 = punctuate foci in gray matter or multiple small vessels in subcortical area; 2 = beginning confluence of foci in gray matter or diffuse small vessels in subcortical area; 3 = large confluent lesions in gray matter (rare, evidence for stroke-related malacia foci)
PV (periventricular lesions) 0 = absence; 1 = ‘caps’ or pencil-thin lining; 2 = smooth ‘halo’; 3 = irregular periventricular abnormal signal intensities extending into the deep white matter
DWM (deep white matter lesions) 0 = absence; 1 = punctuate foci; 2 = beginning of confluence foci; 3 = large confluent areas; 4 = large confluent white matter areas involving all cerebral lobes; 5 = complete confluent white matter disease
BG (basal ganglia and surrounding area lesions) 0 = absence; 1 = 1 focal lesion; 2 = >1 focal lesion; 3 = large confluent lesions IT (infratentorial region lesions) 0 = absence; 1 = 1 focal lesion; 2 = >1 focal lesion; 3 = large confluent lesions
GA (global atrophy) 0 = no obvious atrophy; 1 = mild atrophy; 2 = moderate atrophy; 3 = severe atrophy
Other lesions 0 = no other kind of disease; 1 = any 1 kind of brain neoplasm, deformation or trauma; 2 = any 2 kinds of brain neoplasm, deformation or trauma; 3 = simultaneous presence of brain neoplasm, deformation and trauma


Full text

Related publications: Brain volume/cerebrospinal fluid index (BV/CSF index) in the diagnosis of Alzheimer's disease


BV/CSF index= (Total WM + Total GM) / Total spaces containing CSF

The BV/CSF index may also be named as yrRA-WB(I-II-III-IV-sulci) using the standarized terminology

Background: Global brain atrophy is present in normal aging and different neurodegenerative disorders such as Alzheimer's disease (AD) and is becoming widely used to monitor disease progression. Summary: The brain volume/cerebrospinal fluid index (BV/CSF index) is validated in this study as a measurement of global brain atrophy. We tested the ability of the BV/CSF index to detect global brain atrophy, investigated the influence of confounders, provided normative values and cut-offs for mild, moderate and severe brain atrophy, and studied associations with different outcome variables. A total of 1,009 individuals were included [324 healthy controls, 408 patients with mild cognitive impairment (MCI) and 277 patients with AD]. Magnetic resonance images were segmented using FreeSurfer, and the BV/CSF index was calculated and studied both cross-sectionally and longitudinally (1-year follow-up). Both AD patients and MCI patients who progressed to AD showed greater global brain atrophy compared to stable MCI patients and controls. Atrophy was associated with older age, larger intracranial volume, less education and presence of the ApoE ε4 allele. Significant correlations were found with clinical variables, CSF biomarkers and several cognitive tests. Key Messages: The BV/CSF index may be useful for staging individuals according to the degree of global brain atrophy, and for monitoring disease progression. It also shows potential for predicting clinical changes and for being used in the clinical routine.

Reference: Camila Orellana, Daniel Ferreira, J.-Sebastian Muehlboeck, Patrizia Mecocci, Bruno Vellas, Magda Tsolaki, Iwona Kłoszewska, Hilkka Soininen, Simon Lovestone, Andrew Simmons, Lars-Olof Wahlund, Eric WestmanMeasuring Global Brain Atrophy with the Brain Volume/Cerebrospinal Fluid Index: Normative Values, Cut-Offs and Clinical Associations. Neurodegener Dis (DOI: 10.1159/000442443)

Free Supplementary Material